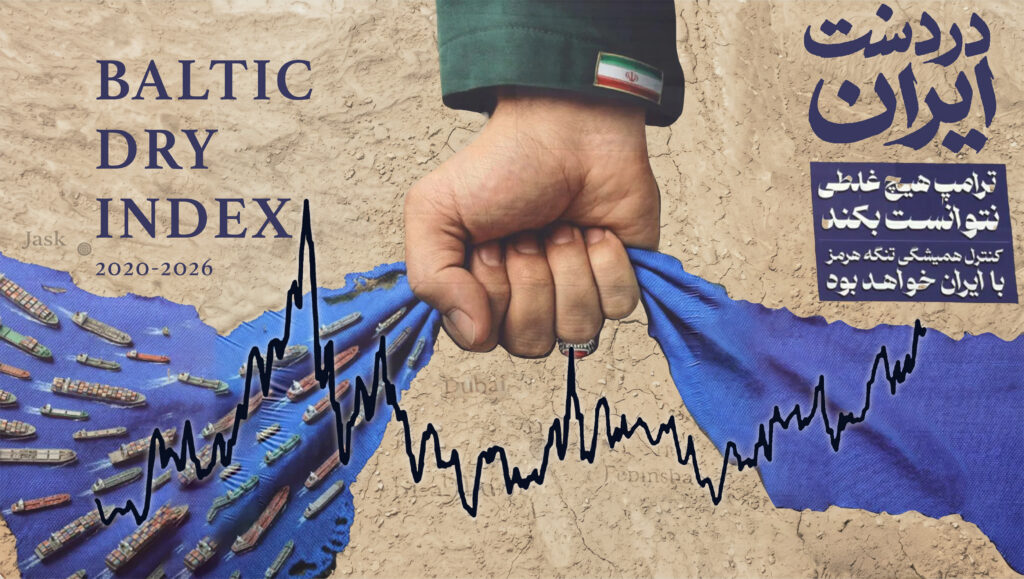
If we were to identify the closest thing to a commodity boom seismograph, a tool to detect early signs of a disturbance in commodity markets, perhaps the Baltic Dry Index might be the thing.
Like a violently-spiking seismograph readout, sharp wobbles in the Baltic Dry Index serve as a leading indicator of shake-ups in commodity markets.
A sudden upsurge in the index proved to be one of the most reliable gauges of the China-driven commodity boom that was to upend the global economy in the first decade of this century.
As a witness to commodity cycles, its memory is necessarily temporal. Since tracking began in 1985, the China Boom that ushered in the 21st century to date stands as the only multi-year boom to have been captured by the index.
Yet the hard, physical nature of what it measures lends it a gravity that resists casual dismissal.
The Baltic Dry Index tracks the cost of shipping bulk commodities by sea, drawing on daily data compiled by international shipbrokers across three major classes of cargo vessels.1
The cargo ships that ferry bulk commodities- classed into Capesize, Panamax and Supramax – are defined, in part, by the geography they can navigate: Panamax vessels take their name from the Panama Canal, their dimensions shaped by the confines of its locks; Capesize ships, designed to ferry iron ore and coal, are generally too large to pass through the gates of the Panama locks, while the handier Supramax ships are compact enough to use a wide range of routes.2
However, size is a relative concept, and even the smallest Supramax-class ships are enormous maritime machines, running at least 150 metres in length from bow to stern.
With lay‑up costs prohibitively high, vessels are almost never pulled from service to weather out short‑term dips in demand. 3
When demand slackens, the Index retreats with little ado. On the other hand, when the tug of demand pulls more strongly than the fleet can answer, the pressure will soon enough be reflected in higher freight costs.
As raw materials account for the greater part of the seaborne dry-bulk trade, sharp spikes in the Baltic Dry Index can serve as a leading indicator of upward trends in commodity prices.4
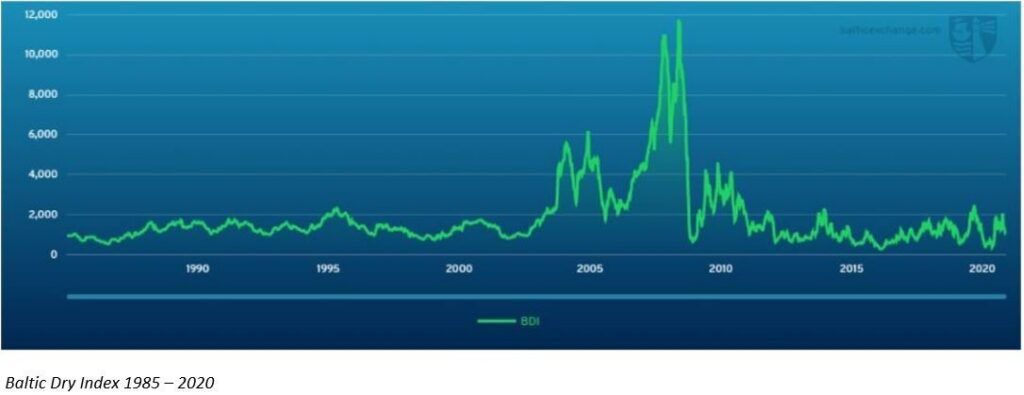
In early 2008, as a seeming ceaseless stream of iron ore and coal shipments crossed the oceans and thence on down through China’s anacondan gape, the Baltic Dry Index soared to levels seen neither before, nor since.
The Global Financial Crisis deflated the towering edifice, driving the Index into a deep slump, before it recovered in 2009 as China’s growth spark returned. But as China’s economy matured and shifted into a less-resource intensive phase, the Index slowly unwound, spending the 2010s oscillating within a narrow, muted band.
Source: (5)
One decade of boom, followed by one of bust, each written in the undulating patterns of the Baltic Dry Index.
As the 2020s mature, the Baltic Dry Index seems to have narrowed on an altogether different tune.
A new tempo, for a new decade; A clearer, more insistent rhythm has emerged from the background noise. Long gone is the thunderous crescendo of the China Boom, yet the tune is markedly more alive than the drawn-out morendo of the 2010s.
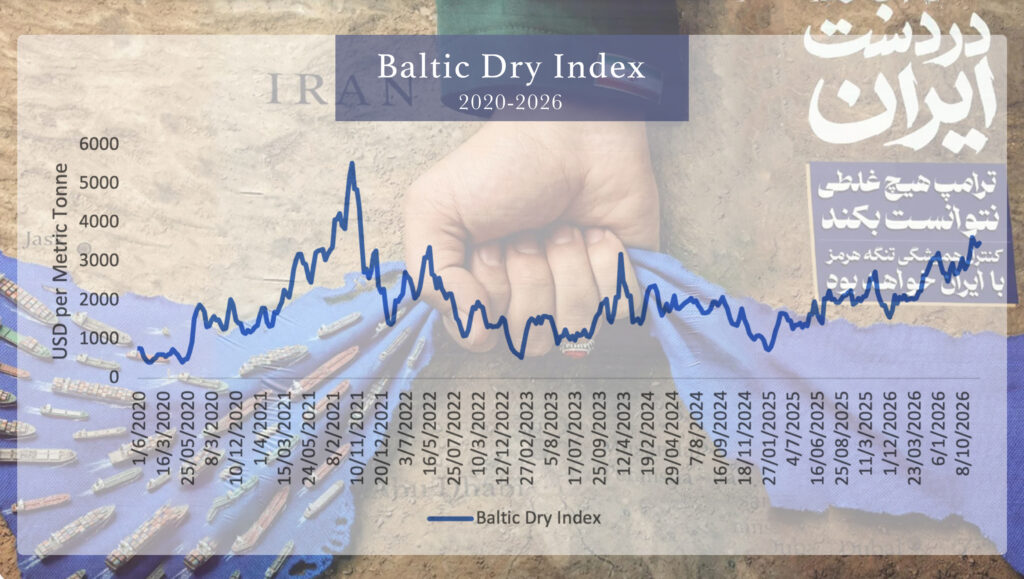
The heightened volatility apparent on the index over the 2020s is all-too easily explained away by the succession of geopolitical flare ups that marked this bellicose decade: Ukraine, Gaza, Iran.
Yet movements of this intensity also point to a deeper hunger on the demand side: new, rising appetites beginning to stir beneath the surface.
Looming over the sharp movements Baltic Dry over the 2020s are the emerging economies of the Indian Subcontinent, charged up and entering into a new and hungry phase of economic growth.
Driven above all by India, in the early 2020s, the economic growth of the Subcontinent began to tilt toward an exponential arc, one that, to all appearances, looked set to continue for many years yet.
That was at least until 2026.
It was in that year that projections of boundless Indian growth careered into a bottleneck: the year India ran into Iran.
Like the froth from a violently shaken champagne bottle, the sharp rise in the Baltic Dry in 2026 tells a tale of contrasts, one of rising affluence on one side, and of spiralling belligerence on the other, twin forces running headlong that have spurred the world on an unstoppable trajectory towards a new age of commodity scarcity.
However, powerful as this tug-of-war squeeze may be across the commodity complex, a third factor, largely out of sight and mind, has also been quietly lending it’s not inconsiderable weight.
While it is difficult to tune out the tremors and trumpets of war in the Middle East, on the far side of the earth, another less heralded force, no less consequential than the physical application of might, has been finding quiet expression in one of the world’s most critical shipping arteries.
Here, the boa constrictor lies in the clouds above us: The silent grip of Mother Nature, quietly throttling the passage of shipping between the world’s two greatest oceans. A nascent El Niño, intensified by global warming, has brought drought to Panama, lowering water levels in the famed canal that cuts across the nation. 6
As drought bites, and capacity drops, the canal is shaping up as second pressure-point on global shipping at the very wrong moment.
A warming world at war…. humanity’s conflict over oil meeting its consequences. Two polar forces, worlds apart, rudely conspiring to interrupt the South Asian growth engine, with shipping costs caught in the middle.
In the analysis that follows, we identify four specific vectors behind the steep rise in the Baltic Dry Index in 2026. Of these four forces, none look fleeting. Instead, they represent deeper structural shifts that could keep the Baltic Dry at elevated levels for years to come.
And with shipping a critical input into commodity prices, the implications extend far beyond the logistics industry. A structurally higher cost of moving commodities could reshape and rebalance commodity markets, creating a new set of winners and losers in the wash-up.
So, let us commence by laying out our four forces on the table. We begin with the most obvious, and perhaps hardest to ignore, the veritable elephant in the room: The world’s new growth engine, South Asia.
Indiran: The Year India Ran Into Iran
When the second Iran war broke out on the last day of February in 2026, the nation under fire turned to a strategy that had been on the cards for decades.
The Strait of Hormuz, the narrow, strategically important corridor off Iran’s southern shores, was transformed into a blazing free-for-all. Warnings went out, shots followed, and tanker traffic bound to the petro states beyond the Strait quickly ground to a halt. As many as 2,000 ships found themselves marooned in the Persian gulf as the gates of Hormuz were slammed shut.
That narrow, strategic throat of global energy serves as a conduit for around a fifth of the world’s oil supply, and a comparable share of its LNG. As the flow of shipping dried up, the flow of energy slowed in turn.
But the extreme spike in the price of oil that was to unfold at a rapid clip was not solely on account of this unexpected supply pinch.
While supply-side factors are frequently invoked to rationalise surges in commodity prices, supply considerations alone seldom explain such extreme price spikes. And repeated recurrences of such spikes – as has been the pattern over the 2020s – are suggestive of greater forces at play.
The crisis at Hormuz emerged at the very moment that the Subcontinent’s two developing ‘elephant economies’, lying due east of the Strait, had started to shift into a higher gear.
Our twin elephants in question -India and Bangladesh- entered a growth spurt as the 2020s got going, their economies galloping ahead as they emerged from the shock of the COVID pandemic that had marred the decade’s opening years.
Suddenly, in 2026, the decade would run into its second unpleasant surprise. A fifth of global oil supply had been choked off at the very moment a region representing a fifth of humanity was beginning its progression into a new resource‑hungry phase of growth.
With the biggest oil shock on record pushing fuel costs sharply higher, and around 2,000 vessels effectively removed from global circulation, a rise in freight costs was inevitable.
As could have been anticipated, The Baltic Dry Index began to stir, steadily ploughing higher throughout April, and reaching, as the months rolled on, its highest level since 2021.
The magnitude and drivers of the 2026 surge suggest that the upward spurt in the wake of the Hormuz crisis is unlikely to be a transient aberration.
The growth-spurt of the South Asian giants is unlikely to be derailed by war-induced higher energy prices … or, at least, not for long. India’s growing hunger for commodities is a potent ‘pull’ factor, that is set to keep demand for shipping elevated for years to come.
But there are also darker forces at work. The geopolitical fractures opened up by war are also likely to place long-lasting pressures on the world’s smooth passage of seaborne trade.
The ‘hot phase’ of the Iran conflict ended after seven weeks with an uneasy ceasefire, which was in turn superseded by an equally uneasy Memorandum of Understanding agreement. Hostilities flared again in July, followed in September by the tentative prospect of a truce as the warring parties explored a phased path out of the war … as well as another threat by President Trump to “annihilate” Iran. As the stop-start-conflagrations rolled on, the question of Hormuz hung over the world economy like a brooding grey cloud. 7, 8
Iran’s insistence that the strategic shipping corridor was under its control ran headlong into an obstinate USA, adamantly opposed to the notion. 9,10
As tensions tapered off, some of the caged-up ships risked the run of the Hormuz gauntlet, often under the purposeful overwatch of the US Navy; while others, defying the threat of US sanctions, and were allowed to leave after going through Iranian channels. At the end of August, six months after the outbreak of the war, the number of daily transits was a fraction of the level of the daily pre-war traffic. 11,12
Strait traffic was up before September’s end, helped along by the U.S. Navy’s coordinated shepherding of tanker convoys. But soaring insurance costs showed the waters off Iran’s coast were far from settled, and the renewed flow of ships was accompanied by a renewed wave of attacks on tankers.
Iran’s stubborn determination to retain its grip over the Strait of Hormuz was no matter of wishful thinking.
Rather, it was born of a harsh new strategic reality wrought by the emergence of a new and infernal weapon.
It is a weapon that has changed the strategic equation, a dangerous djinni that has been uncorked by a feckless conflict, one likely to create a new and persistent new pressure point on the Baltic Dry Index for years to come.
The Drone: A new Albatross around the neck of Seafarers
What made Iran’s bold power play possible, above all else, was a new weapon in its arsenal, the drone.
While the humble Shahed drone may have been less conspicuous as a threat than Iran’s missile program, it is the drone that has rewritten the playbook.
Much cheaper than a long-range missile, and far less dependent on sophisticated production and launch infrastructure, the drone has nonetheless proven to be a potent instrument for projecting power across vast distances. 13
Primitive as they are, and easily enough negated by advanced weapon systems in isolation, they must still be reckoned a serious threat: when launched in large enough numbers, it is likely that a few will penetrate even sophisticated defences.
However, not all strategic targets come equipped with high-tech defence systems. Some are big, slow moving and acutely vulnerable.
The oil-tankers that rely on passage through Hormuz are a case in point.
Typically hundreds of metres long, generally moving no faster than a bicycle and with their passage typically prescribed to narrow deep-water shipping lanes in the Strait, they represent the softest of soft targets.
Drones, of course, are not the only tool the Iranian military has at its disposal to frustrate the passage of shipping in the Persian Gulf.
In the early years of this century, despite a seeming addiction to pursuing wars in the Middle East and North Africa, Iran was the one power that successive US administrations were reluctant to tangle with.
The reason was the long‑recognised Hormuz dilemma. Military analysts understood that it took very little to disrupt traffic through the Strait: a few jet skis each laden with a few mines was all that was required to force a closure that would require an expensive, time‑consuming clearance operation to undo.
The emergence of drone warfare in the war of 2026, however, shifted the equation still further in Iran’s favour.
Unlike the conventional anti-ship weapon, a drone might be launched from a hundred kilometres inland: As Iran’s military were soon to demonstrate, they could now disrupt traffic in Hormuz without getting their feet wet.
In more placid times, over a hundred ships passed through the Strait each day. Faced with not only the threat from the deep, but now a new threat in the skies above, operators steered well clear of the waterway, and shipping volumes had shrunk to less than one‑tenth of their pre‑war level three months after the outbreak of war.
Iran’s weapons stockpile, from century-old sea-mines to hi-tech drones, has bestowed it with a degree of control over the Strait that no outside power can easily challenge. Naval operations, a ceasefire or a diplomatic accord may well temporarily still its waters, but the strategic leverage Iran has acquired is no passing ship in the night: As we will see below, Tehran’s growing toolkit is, if anything, likely to make its grip on the Strait still more difficult to shake in the years ahead.
In the hot-blooded year of 2026, the Persian Gulf would not be the only theatre in which drone attacks have harried shipping.
Iran, in fact, was not the first mover in the field. Ukraine’s armed forces had pioneered the tactic of using naval drones to harass shipping many months before the outbreak of the war in Iran. 14
Even as Iran and the United States locked horns over Hormuz, to the north, Ukraine’s military was employing both airborne and naval drones in the Black Sea to attack oil tankers and cargo vessels carrying commodities and supplies to and from Russia. In early June, for example, a series of attacks on cargo ships by Ukrainian naval drones resulted in the deaths of five Azerbaijani sailors.15
In July, in an unusual instance of ‘role reversal’, it was Iranian seafarers traversing the Caspian who found themselves in the cross hairs of Ukrainian drones, resulting in the death of a civilian sailor onboard.16
Simple and requiring little in the way of complex infrastructure, the drone has put a potent military capability even within the reach of non-state actors.
This much became apparent as the war-blighted year of 2026 rolled on.
In July, two Saudi oil tankers in the Red Sea became the target of attack drones launched by the Houthis, the Iran-aligned insurgents in Yemen. The Houthis had opened up a new front at another critical regional choke point, the Bab al-Mandab strait. 17,18,19
Much as the U‑boat once did in the World Wars, the threat of drone attack has become the seafarer’s nightmare, a menace now haunting shipping well beyond the Persian Gulf.
It is an emerging reality that looks set to bear on the Baltic Dry Index as the years roll on.
The Iran military’s chief weapons in the contest for Hormuz, the shahed and the sea-mine, are, at their bones simple weapons. It would be no great challenge to scale these up into more complex systems, more challenging to stop.
Six months into the war, two events indicated that the arms race had begun in earnest.
On the last day of August, the US military indicated that Iran has modified its rocket systems to launch mines into the Straight of Hormuz.20
Shortly after this, Iran’s Revolutionary Guard captured an autonomous U.S. Navy drone, prompting questions about whether it could be reverse‑engineered into a weapon, potentially amplifying the Persian Gulf’s evolving drone power play. 21
Both represent divergent paths through which Iran’s defence establishment could level-up its control of the contested waterway: Whether by rockets or underseas drones, Iran could effectively cut out the middleman in the mine-laying equation. Boats and their crews might soon become surplus to requirements.
But even with legacy weaponry in mind, keeping the Strait free from drones on high and mines below is an ordeal of Sisyphean proportions.
Precious few seafarers would relish running that hellfire pass. To all appearances, Hormuz has become a maritime quagmire, with no clean or quick path to resolution.
The terrible toll of the conflict will also leave its indelible mark.
When the heart of the global energy chain is held hostage by months of conflict, the aftershocks will reverberate throughout the system long after the guns have fallen silent.
Burning Oil Casts Long Shadows
As long as a cloud hangs over the Hormuz Strait, shipping traffic through the channel is likely to remain below pre‑war level.
But even assuming a lasting resolution to the Hormuz crisis, the disruptions and the devastation wrought on infrastructure across the region will burn a lasting legacy on energy production for years to come.
As the dust settled across the region after the initial ‘hot phase’ of the war waned, the damage wrought by the conflict became apparent. Dozens of oil refineries, oil fields, gas plants, and ports were damaged by missile and drone strikes. 22
Kuwait’s state‑owned petroleum company, which oversees production in the world’s tenth‑largest oil producer, said it would need up to two months to return to roughly 70% of its pre-war output once Hormuz reopens, following severe wartime damage to its facilities. 23,24
Further substantive damage was inflicted on the region’s LNG capacity. Qatar’s Ras Lafan plant, the largest liquid natural gas export terminal in the world, suffered extensive damage and is not expected to return to full capacity until the end of the decade.25
The damage wrought by the conflict across the region has to be baked into projections of the energy‑price outlook for the remainder of this decade. 26,27
But in the more immediate future, the oil supply deficit that has built up as a consequence of tanker-traffic through Hormuz being reduced to a crawl for months will ultimately find expression in higher energy prices, as advanced nations burn through their petrol reserves. 28
And, of course, with oil producers in the region run off their feet for months trying to protect their hard and human assets from drones and missiles raining down from the blue yonder, any thoughts of expansion have been consigned to the bottom drawer.
The consequences of this state of affairs is unsurprising: In September, Saudi Arabia reported to OPEC that its crude oil production had plunged the previous month, sinking to its lowest level in 36 years.29
Meanwhile, directly east of Hormuz, India – which, by 2026 relied on imports for 88% of its crude oil – continues to hunger for energy, a supply‑demand collision that is becoming increasingly acute. 30
Oil producers will be playing catch-up with a train that’s on the runaway.
As one oil trader noted as the war dragged on, “… you’re still left with a hole — whatever you want to call it — a billion barrels of oil that is missing.”31
The wrath of the war has introduced a structural premium into the oil price, one that is unlikely to unwind quickly.
Ships, as thirsty for oil as a whale is for plankton, are particularly sensitive to higher fuel costs, which will, in time, need to be passed through to higher freight rates, as became evident in the Baltic Dry Index’s northward path in the months after the war began.
In this regard, of course, the shipping industry is by no means unique.
In the commodity space, energy represents the ‘one ring to rule them all’.
From the humble farmers tractor, to the drilling rigs of junior mining companies, to the monster-mining trucks of the BHPs of the world, commodity production has been historically, and is still today, a petrol intensive business.
Of course, on this front, change is already afoot. Major mining companies have begun experimenting with battery‑electric haulage, encouraged by the increasingly favourable economics.3233
It is a trend that is likely to accelerate: the 2026 crisis at Hormuz made it abundantly clear that this shift is now an imperative.
The elevated energy-price backdrop should thus deliver a double-fillip to the price of many industrial minerals.
On the one hand, a higher oil price raises the operating costs of the machinery that digs these metals out of the ground, the trucks that haul them to port, and the ships that ferry them; and those costs ultimately show up in the price of every kilo produced.
And, all the while, the surge in diesel prices is nudging companies to migrate to electric alternatives, a transition that is intensely metal‑hungry, from copper and aluminium to lithium, and thence cascading down to the all the inputs demanded by the wider renewable ecosystem. 34
If the Baltic Dry is the weather-vane signalling a gathering commodity tempest, it is minerals, rather than fossil fuels, that sit in the very eye of the storm.
The arguments laid out so far in this piece have been focused on the baleful influence of war-like Mars on the flow of logistics, and might thus impart a suggestion that the Baltic Dry Index functions as a kind of geopolitical weathercock, its direction largely dictated by the winds of war and unrest.
But the truth is far cloudier.
In the seafarers’ trade, Mother Nature has always counted for as much as Mars. This leads us to the last, but certainly not the least, of the four forces shaping the Baltic Dry through the 2020s, one whose influence is only set to magnify.
In the path of Baltic Dry, as will be illustrated below, the orbits of the celestial and the earthly spheres intersect.
War and Water
In pre-industrial times, it was understood that the distempers of heaven were intimately connected to the ructions of the earthly plane. The influence of climate and weather was readily apparent to predominantly rural populations: The wanton vagaries of weather could bring failed harvests, higher food prices, unrest and revolution.
While the average 21st-century citizen leads a more sheltered life than their bucolic antecessors, the distempers that have shaped the truculent twenties are certainly not solely the product of human agency.
Civilisation remains a marionette beholden to the strings of meteorological forces.
While the impact of some meteorological events are abstract and difficult to fathom, the dynamics of others can exert a far more direct influence on people and prices.
Often, their handprints become etched into the course of the Baltic Dry Index.
In the early years of the truculent twenties, as the shock of the pandemic faded into memory, two consequential events emerged that would leave an indelible mark on the Baltic Dry Index.
The first was the reverberations from the first great war of the decade, unleashed by Russia’s full-scale invasion of Ukraine in 2022.
The second, far less heralded even if it was more pronounced, would entify the following year.
On the flipside of the world from Hormuz, at the crux of two oceans, lies another no-less-critical shipping passage: the Panama Canal.
In 2023, this vital artery would find itself caught in the crosshairs of a force far less corporeal than drones and missiles: the tempers of the troposphere.
Since its completion in 1914 after a monumental feat of engineering, the Panama Canal has since served as a critical gateway between the Pacific and the Atlantic Oceans. In the days before it opened, ships travelling between the two had no choice but to take the long way round, literally sailing to the ends of the earth to pass from the world’s second largest ocean into its largest, or vice-versa.
So vital to global shipping is the canal that its very dimensions have come to define a class of vessel. The Panamax class of bulk carrier was engineered to fit the original locks of the artificial waterway whose name they bear.
While Hormuz keeps the world’s oil supply flowing, the agent that keeps the Panama Canal in motion is a liquid that is even more critical to civilisation: Water.
The 80-kilometer canal ultimately depends on the skies above: freshwater, sourced largely from precipitation, is captured and stored in a massive artificial lake, Lake Gatun. The stored water then becomes the Canal’s engine, lifting and lowering ships through a series of locks and carrying them from one ocean to the next.
In late 2023, this reliance on water would cause more havoc to global freight than Russia’s militarism the previous year.
The cause of the canal’s malaise was rain, or lack thereof. Severe drought in Panama, fuelled by the nascent El Niño, resulted in the water level of Lake Gatun falling to its lowest point ever recorded during the rainy season. 35
In December, 2023, shipping traffic in the canal began to back up on account of the low water level, and the Panama Canal authority who administer the waterway were forced to restrict access to the passage.
While in normal times, 36 ships can transit the canal each day, the severe drought of 2023 forced a reduction in daily transits to 22 and the maximum draft to 13.41 meters, resulting in one-fifth fewer vessels passing through, and a 17% drop in tonnage.36
This drought-induced log-jam flowed on though to a spike in the Baltic Dry Index, climbing from just over 1000 points in July 2023 to over 3,000 by the end of November.
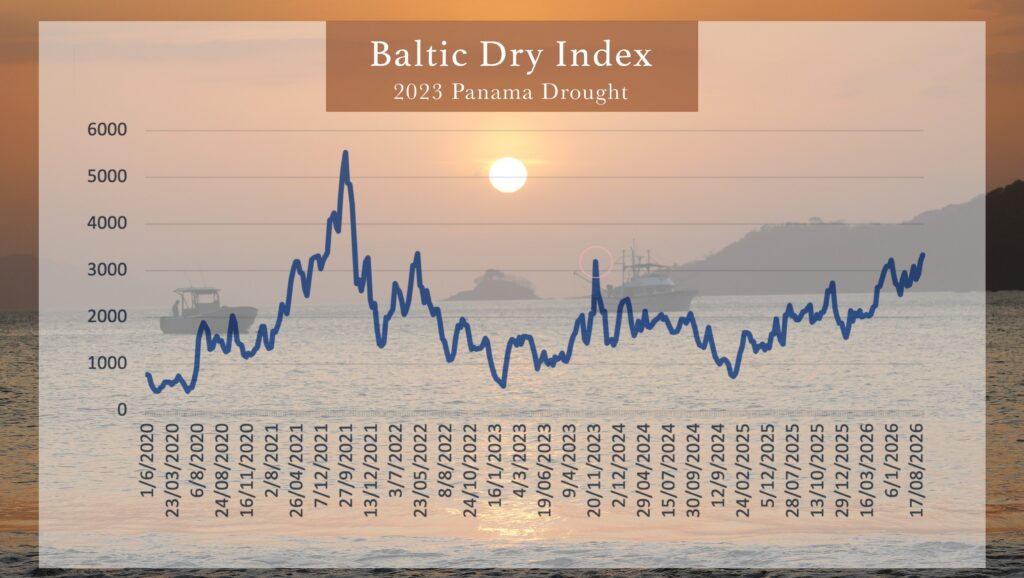
Fortunately, by August 2024 Gatun’s water levels had recovered, and by the start of 2026 it was back to its maximum capacity. 37
But how quickly the worm turns.
As the crisis in Hormuz dominated the news, heads in Panama were turned to the skies: A new El Niño loomed, one that climate models projected to be among the most severe on record.
38, , 39
In a seeming repeat of the episode three years earlier, drought began to bear down on Panama, and the Panama Canal Authority was once more forced to tighten the belt.
In early August, the Authority announced that a 48-foot draft limit would come into effect in September. Before the month was out, the squeeze tightened further: from 3 September, daily transits would be cut from 36 ships to 34, before falling again to 32 from the middle of the month. 40
The drought-induced restrictions come at an inopportune moment.
With Gulf producers unable to export as much oil through the Strait of Hormuz as they did before the war – about 20 million barrels of oil per day – countries are increasingly turning to North and South America to make up supplies, driving more traffic towards the Panama Canal.
The resultant rise in cargo needing to be shipped through the canal instigated a bidding war for transit slots. In August, one South Korean company paid a record US$5.3 million in an auction for priority passage through the Panama Canal for the LPG tanker G. Spirit. 41
As competition for limited transit slots intensifies, some ships are forced onto alternative routes, increasing sailing distances, consuming more fuel and effectively reducing the available capacity of the global bulk fleet. 42
Every day a load of commodities is at sea aboard a bulk carrier, is another day in which it is effectively quarantined from global markets.
Thus, In the sharply rising trend of the Baltic Dry Index over 2026, we see the intersection of war and weather. The two trends have joined together like a pair of supply-squeezing pincers, against a backdrop in which an emerging economic behemoth in South Asia continues to burst at the seams – ever hungry, ever reaching for more.
The twin architects on the supply side of the crunch- fossil fuels and global warming- have one feature in common: the medicine for the two is largely perceived to be much the same, renewable energy systems.
As demand for solar, wind, and electric vehicles climbs, so too does demand for the raw materials, many of them non-ferrous and far from commonplace, that are so critical for their fabrication.
And with each turn on the road ahead leading us toward scarce minerals, it is natural that this will be the hill that upon which our argument finally comes to rest.
Shipping costs and the Commodity Complex
War, drones and drought have all conspired to push shipping costs sharply higher in 2026. The Baltic Dry Index, sitting well below 2,000 at the year’s outset, had climbed above 3,500 by September.
But these disruptions are more than a series of unfortunate events. Taken together, they point to a deeper shift in the forces shaping the cost and availability of seaborne trade.
The severe El Niño events creating capacity constraints at the Panama Canal are being amplified by the global warming trend, indicating that these disruptions are unlikely to be transient anomalies.
The devastation of oil infrastructure coinciding with incessant energy demand from South Asia, guarantees producers will be playing the catch-up game for years. And the drone, its horrible potential now fully revealed, cannot simply be returned to the pandora’s box from which it emerged.
This tetrad of factors exerts a significant upward pull on freight costs, pressures that, ultimately, become embedded into commodity cost bases, creating a feedback loop through which shipping itself becomes a persistent constraint on the cost and availability of commodities.
However, the flow-on impact of these factors would not play out equally across all commodity classes.
A drought‑hit, capacity‑constrained Panama Canal, for example, would not weigh uniformly across the commodity ecosystem. It could be reasonably assumed that the greatest impact would fall on the trades dependent upon the canal -Grains, steel, fertilisers, coal – while the core long-haul iron-ore trade, carried predominantly by Capesize vessels on routes far distant from Panama, would be comparatively insulated.
Within the commodity universe, it is the non-ferrous metals that are likely to feel the pinch most acutely. Non-ferrous metals tend towards scarcity, yet many also sit at the centre of the so-called green-metals scramble, grounded in longstanding concerns about global warming, now made corporeal by the 2026 energy shock. In addition, bulk shipments of non-ferrous metal ores and concentrates are commonly carried by the workhorse Supramax vessels, which, unlike the much larger Capesizes, are more exposed to disruptions affecting the flow of traffic through the Panama Canal. 43
Freight costs represent a significant constraint on their supply even as the very same forces that have been driving freight costs higher are accentuating demand for these metals. The hackneyed phrase ‘perfect storm‘ may well be apt in this rare instance.
But which non-ferrous metals sit in the eye of this emerging commodity storm?
While the impact of shipping costs on individual metals is beholden to a range of factors, our thesis is that Baltic Dry pressures will bear down most heavily on the lower‑value non-ferrous metals.
In keeping with this thesis, we will turn to a series of ‘black boxes’, each of which captures the performance of one of four non-ferrous metals against the gyrations of the Baltic Dry Index over the fractious twenty-twenties.
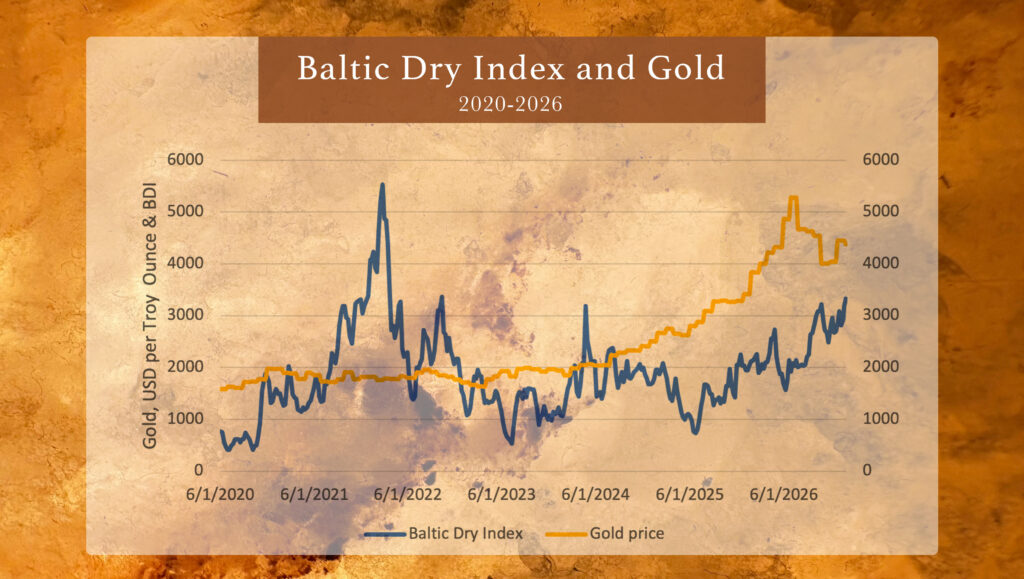
For our starting point, we will turn to a useful control: Gold.
Once synonymous with money – prized, portable, and thus highly fungible – one might expect the bright metal to be largely indifferent to the ups-and-downs of the Baltic Dry Index.
And, sure enough, as our first Black Box reveals, the freewheeling path of the gold price over the twenties seems to be largely indifferent to the eccentric orbit of the Baltic Dry.
If we are looking for more credible contenders for satellite status, they are most likely lurking among the non-ferrous metals a few rungs down the value totem-pole.
Running with this logic, the metals most sensitive to the movements of the BDI might be expected to be those with the lowest value per tonne. So, of our three metals in focus, we will commence the remainder of our review from the highest value metal to the lowest.
Nickel is the highest priced commodity of the three industrial metals in focus, priced at just over $16,000 USD per tonne at time of writing.
Thus, our next Black Box depicts the nickel price against the path of the Baltic Dry Index:
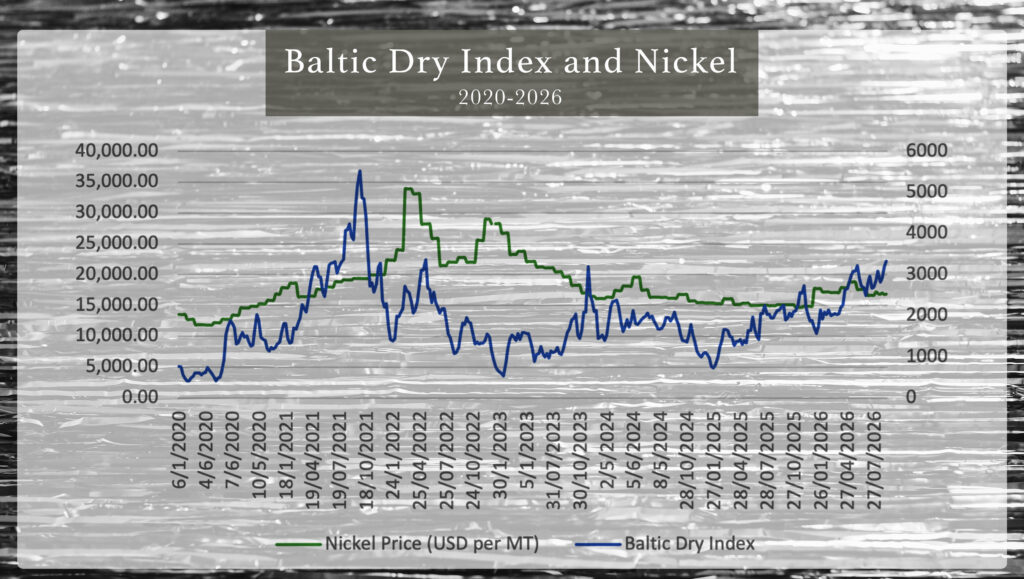
Initially, there seems to be a degree of overlap – at least more so than for gold – but the pattern seems to wear down as the decade rolls on, with the nickel price in seeming retreat as the Baltic Dry Index climbs.
In the case of copper, the object of our third Black Box, the overlap appears a little stronger, though not perfectly aligned.
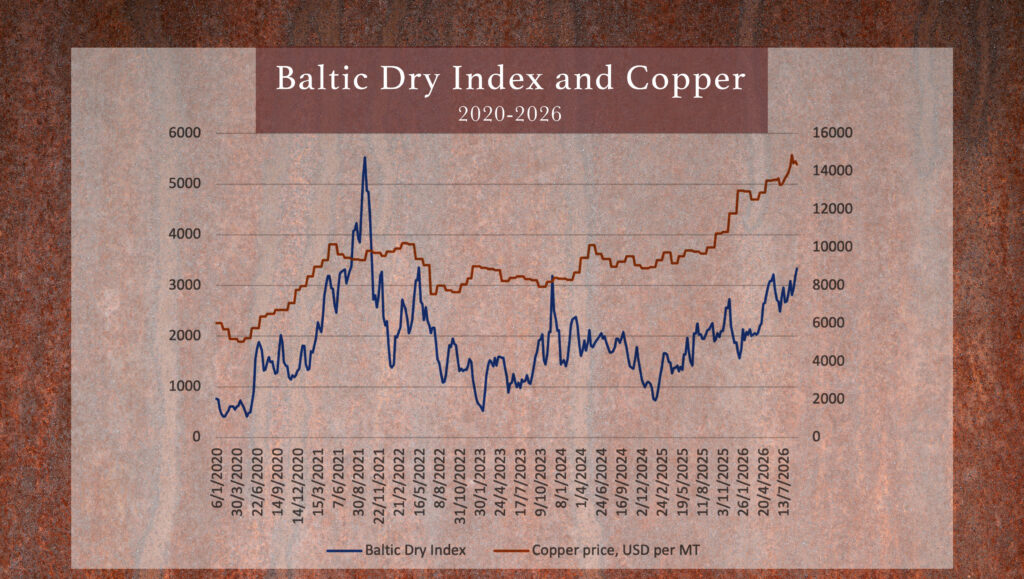
Copper’s price soared in 2026, its dollar value per ton not far removed from that of nickel by the close of the year.
Finally, we turn to zinc.
Zinc is an instructive test-case: The dollar-value per ton ($4000) at time of writing is a fraction of that of copper or nickel.
So, does our thesis hold?
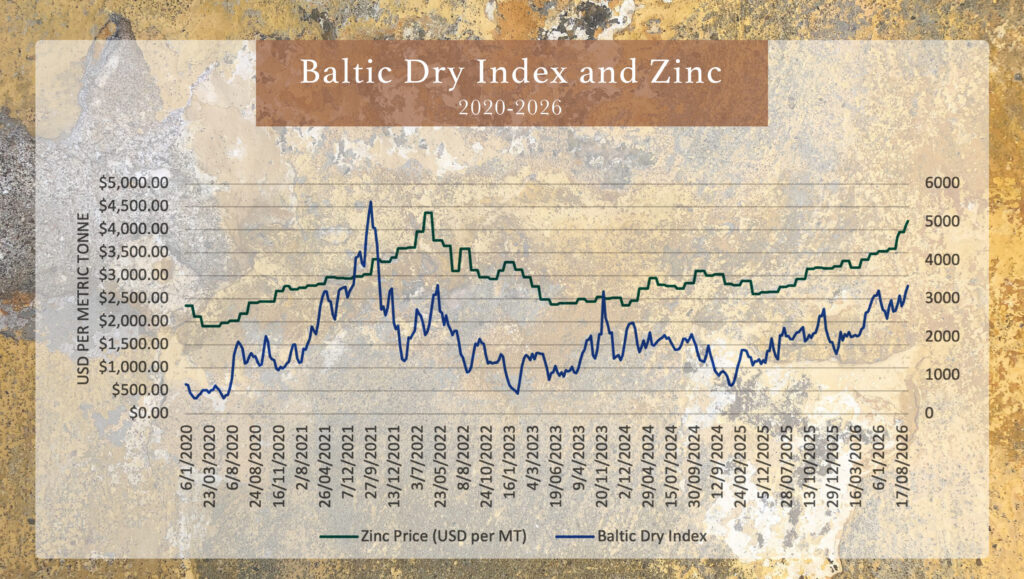
The answer would appear to be in the affirmative.
Over the course of the 2020s, Zinc would seem to bear the closest alignment with the Baltic Dry Index of the four metals that have been our focus.
If we take the view that the Baltic Dry Index is likely to climb, our analysis indicates that the low‑priced industrial staple, zinc, is likely to also feel the upward tug.
As has been argued over the course of this article, the rise of the Baltic Dry Index in 2026 has been shaped by four powerful forces, all of which appear to be structural in essence.
Assuming that the Baltic Dry Index has entered into an upward slope- punctuated – no doubt, by periodic dips, but with the underlying trajectory remaining positive for several years – this should be read as a signifier, perhaps the clearest of any indicator, that a long-term commodity boom is at hand.
Indeed, movements in the Baltic Dry may represent the best available early indicator of such a boom: whatever the precise combination of forces driving it higher, sustained strength in the cost of transporting the world’s basic commodities points to a fundamental increase in demand for those commodities.
With shipping itself a significant input cost, a sustained rise in freight rates reinforces hot inflationary dynamics, giving shape to a new tailwind driving a powerful commodity up‑cycle.
Footnotes
[1]Baltic Dry Index Explained: BCI, BPI, BSI and How Each Subindex Works
[2]Ibid
[3]Why you should care about the Baltic Dry Index
[4]The Baltic Dry Index, 1985–2022 | The Geography of Transport Systems
[7] US–Iran memorandum of understanding in full — BBC News
[8] Oil prices slide about 2% as US, Iran explore path out of war — Reuters
[9] IRGC warns ships off Oman’s corridor in Hormuz as Rubio draws line on tolls — Euronews
[10] Tehran aims to make the Strait of Hormuz a toll route permanently — Bloomberg | UA.NEWS
[11] Hormuz Traffic Craters to Four Ships as Iran–U.S. Strikes Escalate — OilPrice.com
[12] Why the Strait of Hormuz Is at the Heart of the US–Iran Stalemate — EnergyNow.com
[14] Ukraine Hits Russia ‘Shadow Fleet’ Tanker in Mediterranean, First Time — Business Insider
[15] Ukraine Attacks 5 Cargo Ships in Azov Sea & Romania’s Port of Constanta — MarineInsight
[16] For a young sailor: First voyage, final farewell — Tehran Times
[17] Yemen’s Houthis claim attack on two Saudi oil tankers — Al Jazeera
[18] Houthis claim missile and drone strikes on two Saudi oil tankers in Red Sea — Türkiye Today
[19] Yemen clashes kill 81 as Houthis advance toward Bab el‑Mandeb — Türkiye Today
[20] Has Iran modified its rocket systems to fire mines into the Strait of Hormuz? — France 24
[22] Here’s a List of Gulf Energy Infrastructure Damaged in Iran War — gCaptain
[23] Kuwait Says Oil Output Won’t Recover for 10–12 Weeks After Hormuz Reopens — OilPrice.com
[26] Middle East Energy Infrastructure Damage Close to $60 Billion — OilPrice.com
[27] Iran war damaged as much as $58 billion of energy infrastructure: Rystad — CNBC
[29] Saudi Arabia cuts oil output to lowest this year on Houthi threats — Financial Times
[30] India’s Oil Import Dependence Climbs to Nearly 89% as Domestic Output Lags — OilPrice.com
[31] Why oil’s not at $200 after the biggest supply shock in history — Economic Times Energy
[32] BHP and Rio Tinto welcome first Caterpillar battery‑electric haul trucks to the Pilbara — BHP
[36] How El Niño is choking the Panama Canal — Phys.org
[37] Panama Canal Opens Spillways as Reservoir Hits Maximum Level — gCaptain
[38] El Niño: what it means for Australia’s climate — Bureau of Meteorology
[39] This El Niño is different. Here’s why — Conservation International
[40] Panama Canal Cuts Draft for Largest Ships as El Niño Intensifies — Maritime Executive
[41] Why drought at the Panama Canal matters for your wallet — CNN
[42] Panama Canal bulker transits fall 22% — WorldCargo News
[43] Baltic Dry Index Explained: BCI, BPI, BSI and How Each Subindex Works — Shipfinex